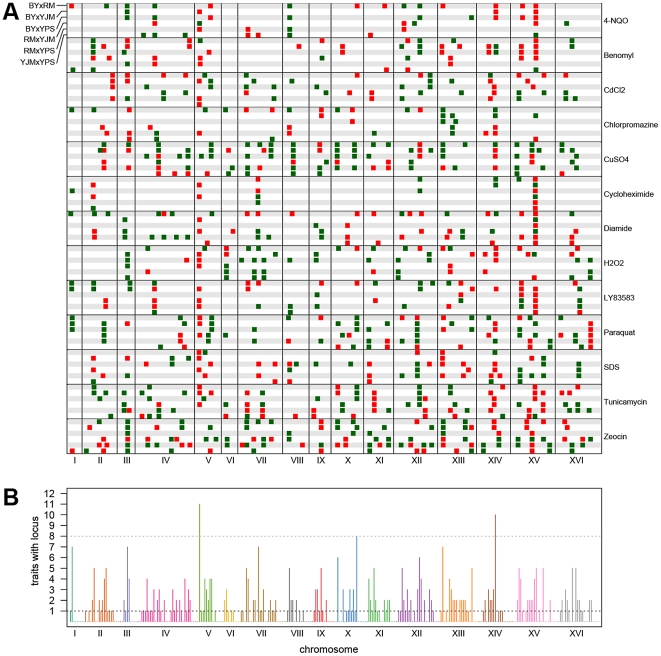
Figure 2. Genome-wide plots of detected loci.
(A) Loci detected for each cross and trait, with green indicating loci selected in the direction of the MATα parent and red indicating loci selected in the direction of the MATa parent. For each trait, the crosses are vertically ordered as follows: BYxRM, BYxYJM, BYxYPS, RMxYJM, RMxYPS, YJMxYPS. (B) The number of traits affected by loci within each 50-kb window. The grey dotted line shows the threshold for significance, while the black dotted line highlights the bins in which only one trait was affected.

