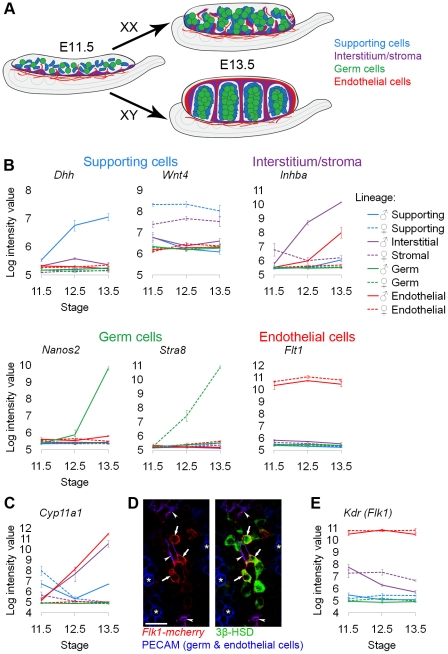
Figure 1. Sorted cell lineages and microarray validation.
(A) Illustration of the developing XX and XY gonad with supporting cells (blue), interstitial/stromal cells (purple), germ cells (green), and endothelial cells (red). (B, C, and F) Graphs of the log-transformed, normalized intensity values from the microarrays for control genes known to be specific to each lineage. The color for each lineage is conserved in all figures and matches the illustration (A), with XX (♀) values shown as dashed lines, and XY (♂) values shown as solid lines. The error bars are standard error of the mean (“standard error”) of the log transformed values. The Y-axis scale differs for each graph because each transcript cluster has its own intensity range. (B) The control genes were found in the expected lineage, except for (C) genes characteristic of Leydig cells. Leydig cell genes were highly expressed in both the interstitium (as expected) and the endothelial cell fraction. (D) Immunofluorescence of E13.5 XY gonads with Flk1-mCherry (red), PECAM1 (germ and endothelial cells, blue), and 3β-HSD (Leydig cells, green). Arrowheads indicate Flk1-mCherry and PECAM1 double positive endothelial cells. Arrows indicate Flk1-mCherry positive, PECAM1 negative cells that were positive for 3β-HSD, confirming aberrant reporter expression in some Leydig cells. Asterisks indicate germ cells positive for PECAM1 alone. Scale bar = 25 µm. (E) The XY interstitial cells have very low expression of the endogenous Flk1 (Kdr) transcript at E13.5, supporting our conclusion that the Flk1-mCherry transgene is aberrantly expressed in Leydig cells.

