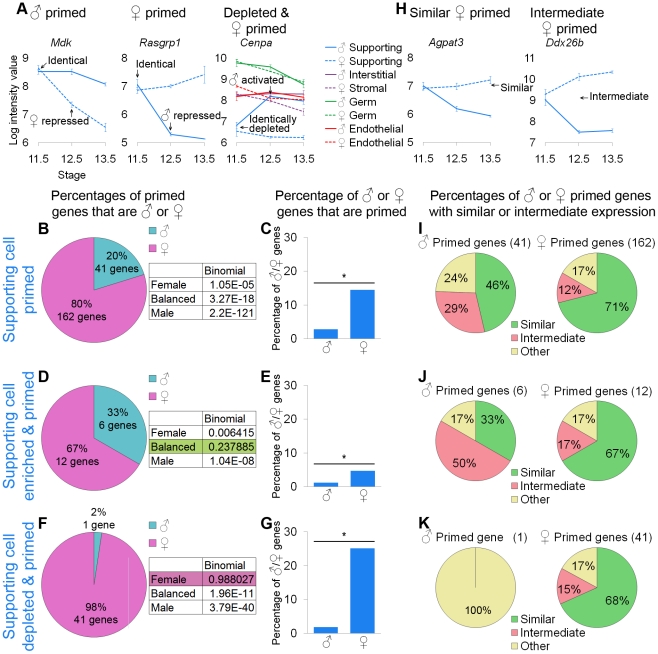
Figure 5. Supporting cells showed lineage priming with a female bias.
(A and H) Graphs of the log-transformed, normalized intensity values of genes. The error bars are standard error. Only the values for supporting cells are shown, except in the depleted and primed example where all cell types are shown. (A) Mdk and Rasgrp1 are examples of male- and female-primed genes and Cenpa is an example of a female-primed depleted gene. As in the germ cell analysis, we examined all primed genes (B, C, and I), primed and lineage-specifically enriched genes (D, E, and J), and primed and lineage-specifically depleted genes (F, G, and K). (B, D, and F) The percentages of primed genes that were male-primed and female-primed. The boxes contain the p-values from the binomial test with the expected percentages of the extreme models. (B) Using the first method, all of the extreme models could be excluded because they had a p-value<0.05. (D and F) However, using the second and third methods, the balanced and female models could not be excluded, respectively. (C, E, and G) Nevertheless, examining the percentage of male or female genes that were primed, all methods showed a significant (*) bias toward the female pathway, as determined by the hypergeometric test (p-value<0.05). Taken together, the data supported female-biased priming. (H) Graphs illustrating two primed genes, whose expression in the progenitor is “similar” to the differentiated cell of one sex, or “intermediate” between the two sexes. (I–K) The female-primed genes were predominantly similarly expressed, but the male-primed genes showed more variability. Gene lists and permutation tests are provided in Dataset S4.

