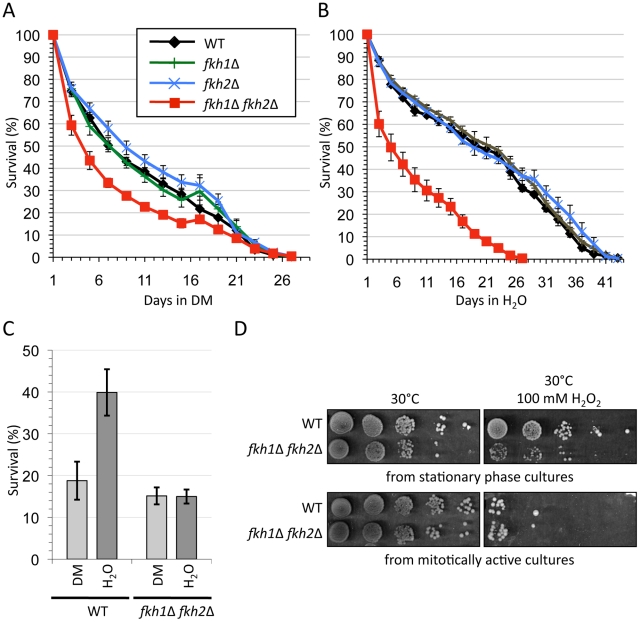
Figure 1. FKH1 and FKH2 encode redundant determinants of lifespan and stress response.
(A) and (B) The cells shown were grown in CM (2% glucose) to stationary phase. The cells were either left in (A) depleted CM (DM), or (B) washed and resuspended in H20 for the remainder of the experiment. Colony counts were performed every other day throughout the experiment. The day when the colony count peaked was considered Day 1. Standard error is shown for at least 3 replicates. (C) Acute oxidative stress in stationary phase cells. WT and fkh1Δ fkh2Δ cells were grown to day 5 of stationary phase with maintenance in either DM or H2O. 100 mM H2O2 was then added to one half of each sample and incubated for 60 minutes at 30°C. Diluted cells were then plated on YPD media and the colony forming units were counted. Survival was determined by dividing the colony forming units following H2O2 treated by untreated samples. Standard error of at least 3 replicates is shown. (D) Chronic oxidative stress in mitotically active and stationary phase cells. WT and fkh1Δ fkh2Δ cells from overnight log phase cultures or day 5 stationary phase cultures were treated with 100 mM H2O2 at 30° for 1 hour, as above, then spot diluted onto YPD plates in the absence of stress. The plates were grown at 30°C for 3 days.

