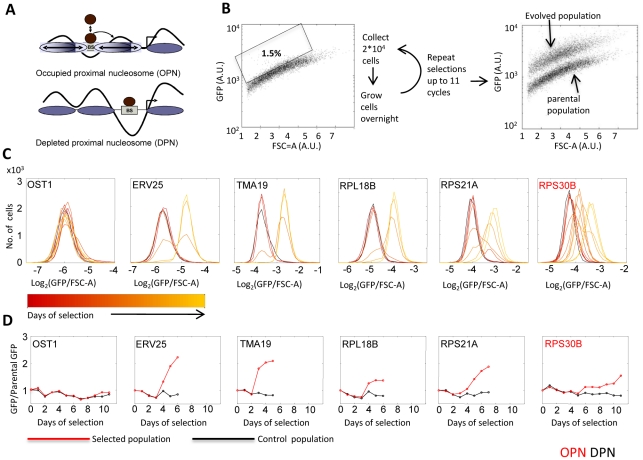
Figure 1. Selection for high gene expression.
A: OPN versus DPN promoter organization: Schematic representation of nucleosome organization in promoters of the OPN and DPN classes. B. Selection for high expression: Strains expressing a GFP-fused protein were obtained. FACS was used to select the 1.5% cells with highest fluorescence, normalized by the forward scatter area (FSC-A). The distribution of FSC-A did not change between the parental and evolved strain, indicating that selection did not increase cell size (Materials and Methods). C–D: Increased expression in response to selection: The distributions (C) and medians (D) of fluorescence levels at successive days of selection are shown for representative genes. Fluorescence values are normalized to FSC-A (Materials and Methods). Data for all strains is given in Figure S2.

