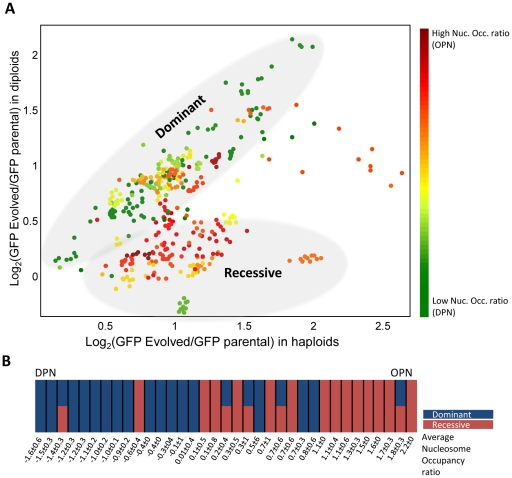
Figure 2. Genomic changes correlate with the gene promoter structure.
A. Classifying mutations into dominant versus recessive: Eleven single colonies were isolated from each of the evolved strains and the underlying mutations were classified as dominant versus recessive by mating with a WT strain. The parental strain was mated with the same WT strain, and was used as a base-line for defining the fluorescence increase. Shown is the increase in fluorescence in the heterozygote diploids versus the increase in the respective haploids. The color code depicts the nucleosomes occupancy score (Materials and Methods). In five cases, a single gene was associated with both dominant and recessive colonies, as shown in B. For details of each of the individual strains see Figure S3. B. Dominant versus recessive mutations correlate with the DPN versus OPN promoter organizations: genes are organized according to the nucleosome occupancy score and are color-coded based on the mode of evolution (dominant versus recessive). The mean OPN measure (ratio of nucleosome occupancy at the promoter proximal versus distal region) of the dominant mutation is −0.5219 (with std of 0.7619) while that of the recessive mutations is 0.9129 (std of 0.7468) the two distributions differ with a p-value of p = 1.6364e-005. See Table S1 for further summary of the results.

