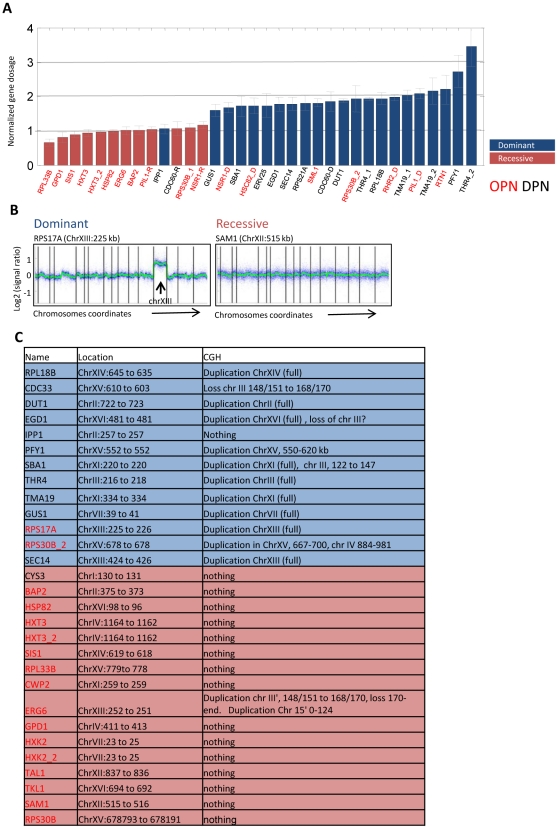
Figure 3. Dominant mutations involve large-scale genomic duplications.
A. GFP copy number in the evolved strains: GFP DNA copy number was measured using real-time PCR. Values shown are normalized and are averaged over two biological repeats of three single colonies from each evolved strain. Two genes (RPS17A and CDC33) are omitted since we could not obtain reproducible results. These genes were analyzed for duplications by CGH. Dominant and recessive colonies associated with the same gene were analyzed separately and are shown with the corresponding D and R labels. Cases of repeated evolution are also shown (e.g. HXT3_1 and HXT3_2). The color code distinguish dominant versus recessive mutations. B–C. Dominant mutations involve large-scale genomic duplications: CGH analysis was used to define genomic rearrangements in the evolved strains. Shown are the hybridization ratios (relative to wt strain) of probes ordered by their genomic location. An example of a dominant strain harboring full chromosome duplication and a recessive strain with no apparent genomic rearrangements are shown. Vertical bars mark chromosome ends. Results for all strains are summarized in Table S1 (C, see also Figure S5). Color code is as in A.

