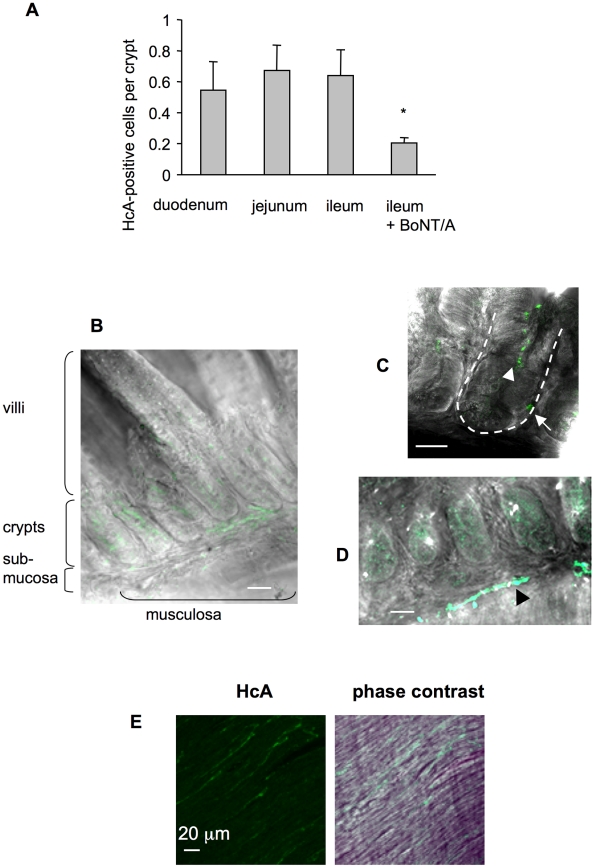
Figure 3. Visualization of HcA in the mouse intestine following inoculation into the intestinal lumen.
(A) HcA-Cy3 (0.5 µg) was injected into ligated ileum, duodenum, or jejunum loop. After 30 min of incubation, the samples were fixed and the mucosal fluorescence was measured as the number of HcA-positive cells per crypt. The number of labeled cells was similar between the three intestinal segments, but significantly lower (*) in the competition assay with BoNT/A (2.5 µg) in an ileal loop (Student's t test). (B) Detection of HcA (green) in the intestinal crypts and in some submucosa areas. No or only weak labeling is observed in the intestinal villi. (C) Visualization of HcA in intestinal crypt lumen (arrow-head) and inside some intestinal crypt cells (arrow), and (D) on filaments in the submucosa (black arrow head) after 30 min incubation. (E) HcA labeling of filaments (corresponding to neurofilaments, see Figure 7) in the musculosa after 90 min incubation. (scale bars = 20 µm).

