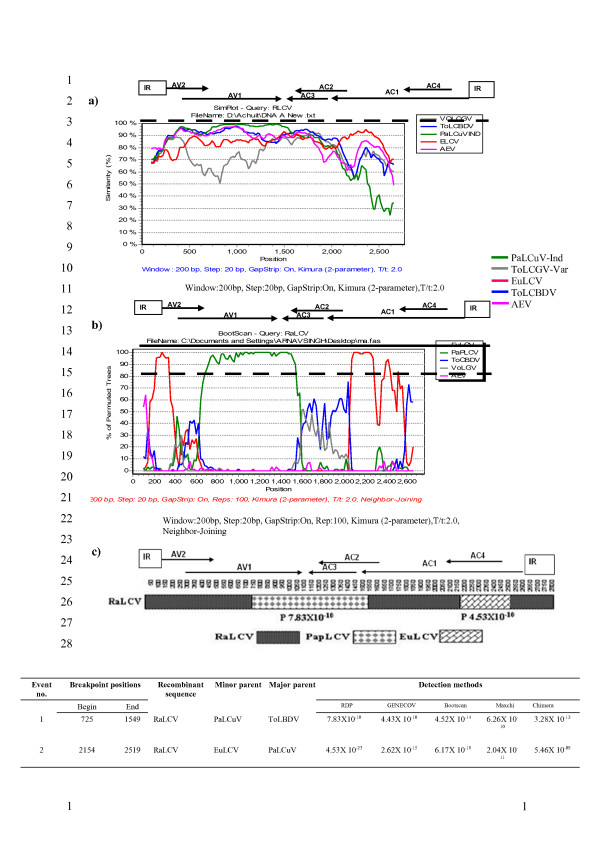
Figure 3.
Recombination analysis of RaLCV genome. Similarity plot (a) and bootscanning (b) analyses of the RaLCV DNA-A using the SimPlot, version 2.5. Bootscan graph of RaLCV versus begomovirus strains constructed by using the neighbor-joining tree algorithm, the Kimura-2 distance model, and 100 pseudoreplicates. The dotted line shows an arbitrary 70% reliability threshold and the solid line shows the demarcation of species and strains (c) schematic representation and analysis of the linearized genomic DNAs of RaLCV showing the origin of the fragments, recombination breakpoints and putative parental viruses.

