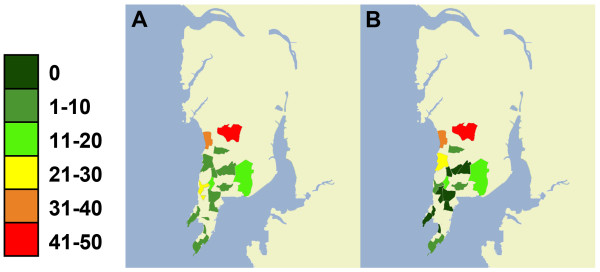
Figure 4.
Distribution of responses by neighborhood from 2010 and 2011 Mumbai surveys. Responses from 2010 (A) illustrate all neighborhoods entered by all Turkers (in the city of Mumbai). In 2011 (B) the survey was altered to ask Turkers to select the neighborhood in which, or closest neighborhood to which they live

