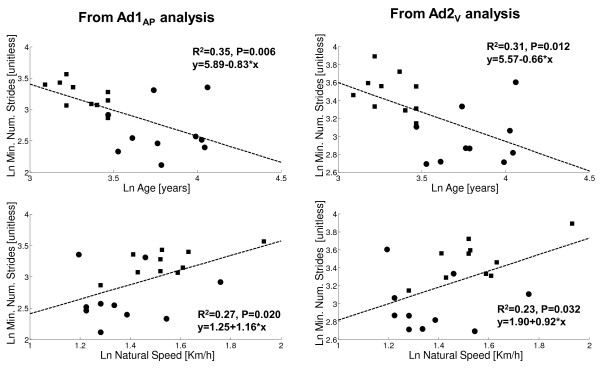
Figure 4.
Regression analysis between minimum number of strides and age or natural speed. Circle - amputees; Square - control subjects. Left panel: minimum number of strides for Ad1AP computation (top: relationship with age; bottom: with natural walking speed). Right panel: minimum number of strides for Ad2V computation (top: relationship with age; bottom: with natural walking speed). R2 and P values, and regression equations, are reported. Variable distributions are logarithmically transformed.

