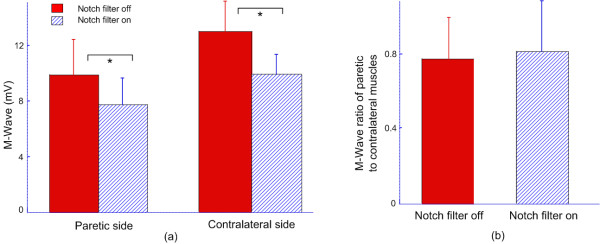
Figure 4.
(a) Bar plots showing the maximum M wave amplitude in presence and absence of notch filtering for paretic and contralateral muscles; (b) A comparison of the maximum M wave amplitude ratios of paretic to contralateral muscles in presence and absence of notch filtering. "*" indicates significant difference (p < 0.001).

