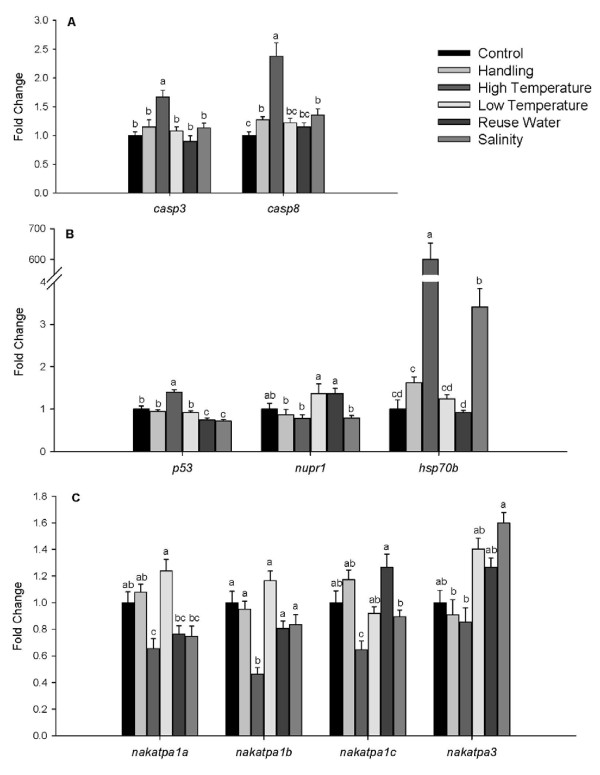
Figure 4.
Differential Expression in Response to Stress. Figures 4a-c show the fold change in expression for genes involved in the stress response in gill tissues of fish within each treatment. Values represent fold change in expression compared to the control treatment, which was set at 1.0. Means without a common letter represent significant differences, P ≤ 0.05.

