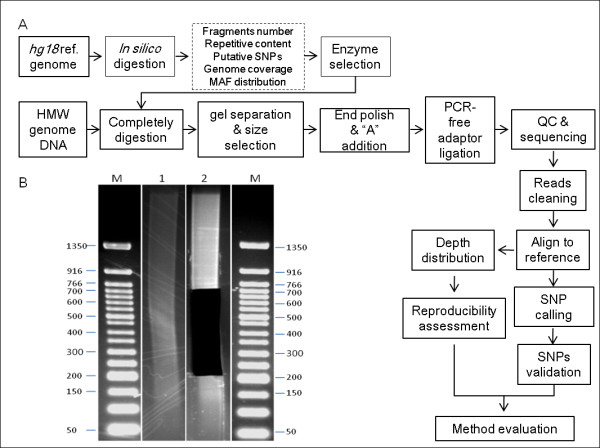
Figure 1.

Main workflow of library construction and data analysis. (A) The workflow summarized the whole process including enzyme selection, library construction and data analysis. (B) Gel image of completely digestion of YH genome by Tsp 45I (lane 1) and gel image after gel extraction (lane 2). Lane M shows 50 bp molecular ladder with size indicator aside.
