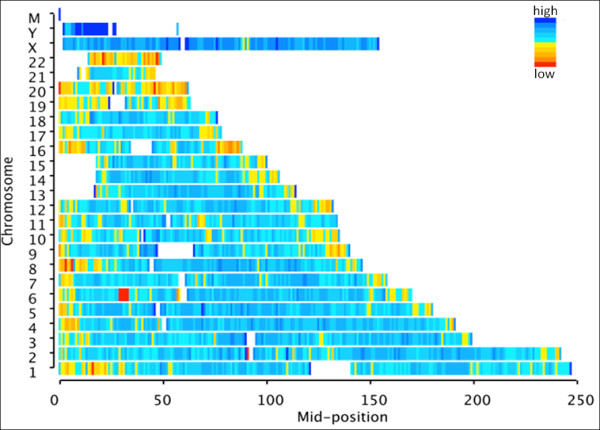
Figure 4.

Distribution of putative SNPs along chromosomes of reference genome. The x-axis represents the relative position across each chromosome, and the y-axis represents chromosome coordinates of the reference genome. The colour from red to blue indicates the increased density of putative SNPs in each selected window across the chromosome.
