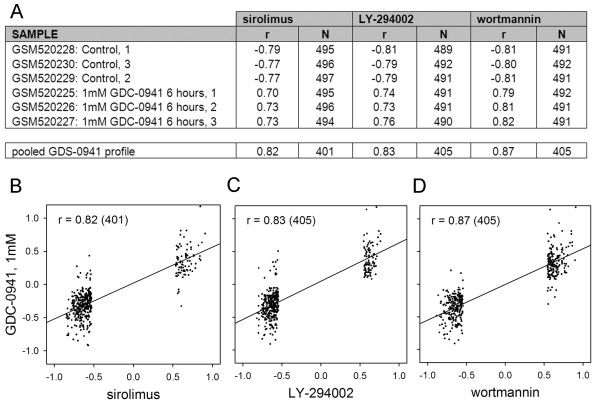
Figure 1.
High scoring correlations in the SPIED with queries derived from the CMAP profiles of rapamycin, LY-294002 and wortmannin are with a pI3 kinase inhibitor GDS-0941. The individual sample scores and the regression scores (in this and later Figures/Tables r is the Pearson correlation coefficient and N is the number of genes in the given correlation) with the treatment and control groups are shown in A. The pooled profiles are defined by the ratios of the treatment to control averages. The fold regression plots are given in B, C and D.

