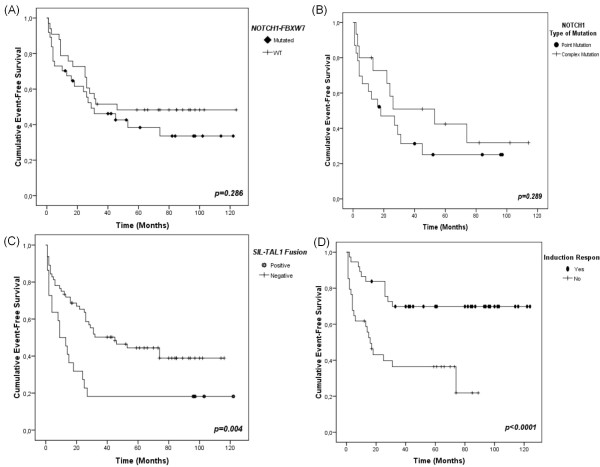
Figure 2.
Kaplan-Meier event-free survival curves (EFS) for T-ALL patients. For the EFS endpoint we performed survival analysis in 95 out of 138 T-ALL patients. (A) EFS curve for patients harbouring NOTCH1-FBXW7 mutations vs. WT cases. In the construction of this EFS curve were included 70 patients, 37 with NOTCH1-FBXW7 mutations and 33 WT. (B) EFS according to the type of NOTCH1 mutations (complex vs. point). This curve is corresponding to analysis of 38 patients with EFS and NOTCH1 type of mutations available data. Twenty-three patients presented point mutations and 15 complex mutations. (C) SIL-TAL1 fusion negative impact on EFS. Eighty-six patients were analyzed for SIL-TAL1 prognostic role in EFS, 22 SIL-TAL1+ and 64 SIL-TAL1-. (D) EFS of patients that respond to induction compared to those without response. Symbols represent censored cases. For the construction of this EFS curve were analyzed 71 patients, being 37 with induction response and 34 with no response.

