
Figure 4.
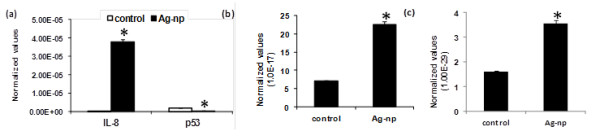
mRNA profile as measured by RT-PCR. (a) Elevated levels of IL-8 in IMR90 cells. (b) Increased mRNA levels corresponding to MAPK1 in normal cells. (c) NFκB mRNA levels in cancer (U251) cells. Data is represented as mean ± SE from three independent experiments. Statistical significance was determined between untreated and treated samples using Student's t test. *p ≤ 0.05.