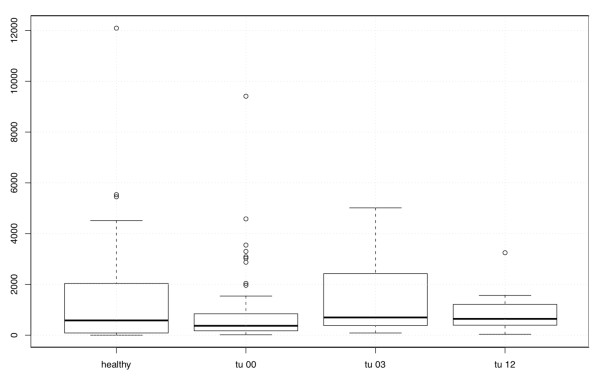
Figure 4.
Boxplots of the serum levels of ADAM8 in all 4 groups. Healthy represents the ADAM8 expression in the healthy control group N = 31, tu00 represents the ADAM8 expression in the serum of tumor patients at the time of diagnosis, N = 79, tu03 represents the ADAM8 expression in the serum of tumor patients 3 months after treatment N = 35, and tu12 represents the ADAM8 expression in the serum of tumor patients 12 months after treatment N = 10.

