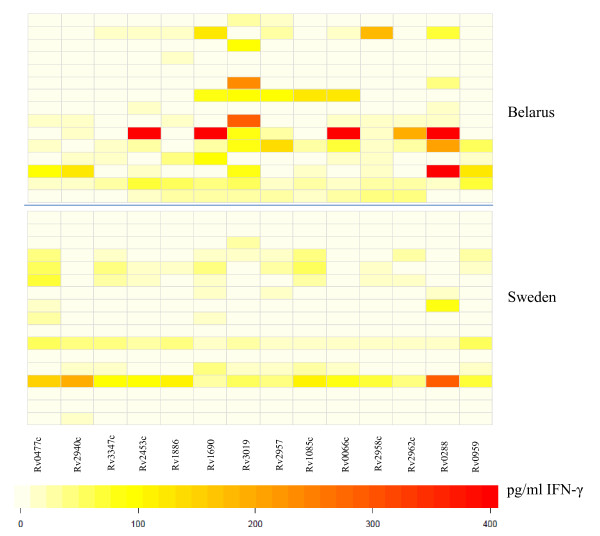
Figure 2.
Visualization of differences in IFN-γ production in response to M.tb peptide pools in PBMCs from healthy individuals from Belarus as compared to Sweden. Darker colors (red) represent higher and lighter colors (white) lower INFγ production. Top panel: Healthy individuals from Belarus (n = 15) and Bottom panel: from Sweden (n = 15).

