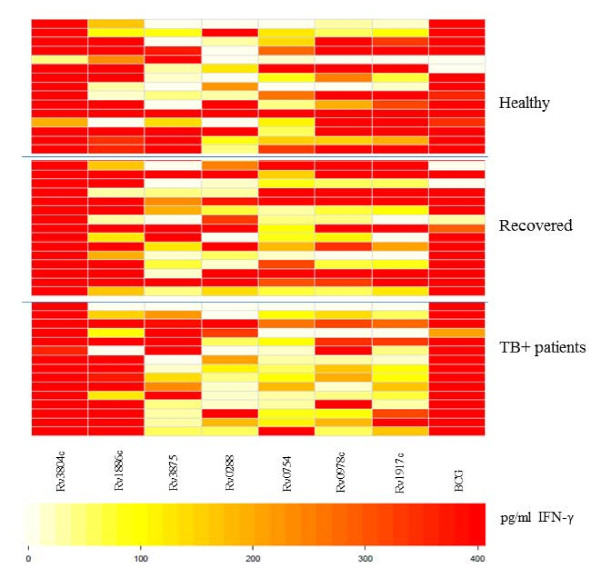
Figure 3.
Visualization of differences in IFN-γ production in response to M.tb proteins. Blood was obtained from individuals from Belarus and incubated with different M.tb proteins followed by detection of IFN-γ production. Darker colors (red) represent higher and lighter colors (white) lower INF-γ production. Top panel: Healthy individuals (n = 15); Middle panel: Individuals recovered from TB (15 =). Bottom panel: TB + patients (n = 15) from Belarus.

