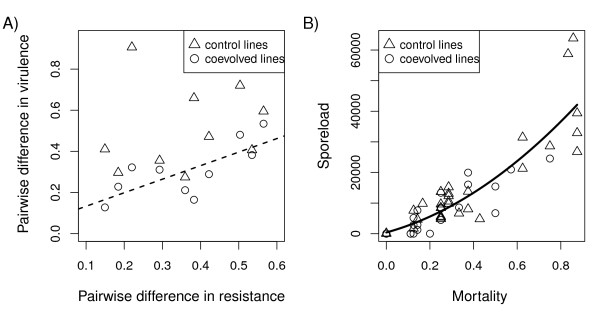
Figure 2.
Correlations between fitness measures. A) Correlation between mean mortality in the eight randomly sampled beetles in each experimental block, and mean spore load as a response variable. The solid lines shows the best fitting model (R2 = 0.80, F2,57 = 117.01, P < 0.001). Overall, there was a significant correlation between spore load and sampled mortality (Spearman rank correlation, r = 0.89, P < 0.001). B) Association of host (virulence) and parasite (failure due to resistance or infectivity) mortalities. The pairwise differences between host populations (virulence) are plotted against the respective pairwise differences in the parasite populations. Parasite population differences correlated with coevolved host differences, but only for coevolved (broken line; Mantel test, Coevolved hosts: r = 0.74, P = 0.009) and not for control hosts (r = 0.16, P = 0.308). Shown is the best fitting linear model for the coevolved hosts. s

