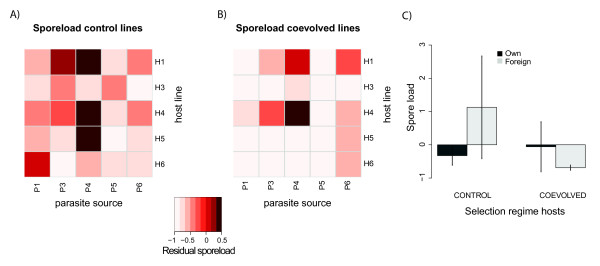
Figure 3.
Heatmap of residual spore load controlled for mortality for all host-parasite combinations for A) the control and B) coevolved hosts separately. Shades of red indicate residual spore load, with lighter shades corresponding to higher residual spore load (see legend). C) Bar charts of residual spore load when exposed to own parasites (dark grey bars) and foreign parasites (light grey bars). Corresponding statistical details can be found in Table 2. Error bars denote ± 1 S.E.

