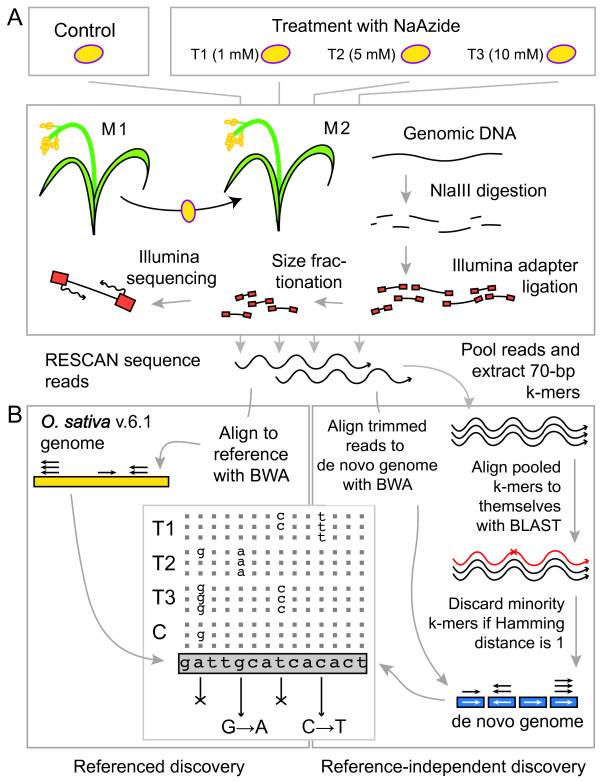
Figure 5.
Overview of experimental material and mutation discovery strategy. The figure summarizes the steps undertaken in the mutation analysis. A. Plant mutagenesis, growth of M2 plants and production of RESCAN libraries. B. Informatic strategy for identification of mutations. The panel compares the bioinformatic process used with the genomic reference (left) and without (right). The table in the center bottom illustrates the strategy to identify mutations, which are expected to occur both as heterozygous and homozygous changes. T1, T2, T3 are mutagenized individuals. C is a control. For each position, calls concordant with the reference are dots, those discordant are base symbols. In the case of the second base A > G changes are found in multiple individuals and therefore cannot represent mutations (cross-out symbol is used). The fifth base G, however, displays changes unique to a single mutagenized individual. The G > A change is accepted. BWA and BLAST refer to the alignment programs used.

