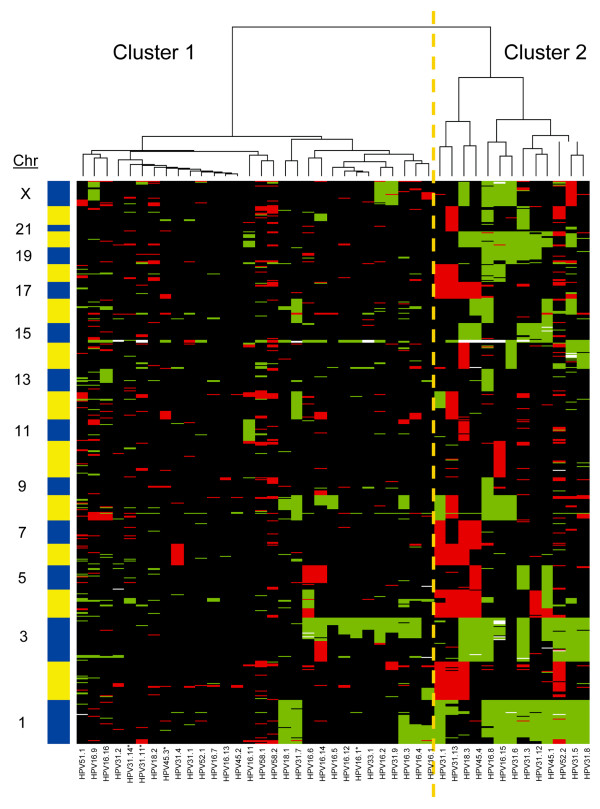
Figure 1.
Results of WECCA clustering on all the CIN2/3. Cluster 1 contains CIN2/3 with few chromosomal aberrations; the majority of the samples in the right subcluster primarily show a gain of 3q. Samples in cluster 2 have more chromosomal aberrations, including gained regions on chromosomes 1, 3q and 20 and more chromosomal losses. Samples with * are CIN2, the others CIN3.

