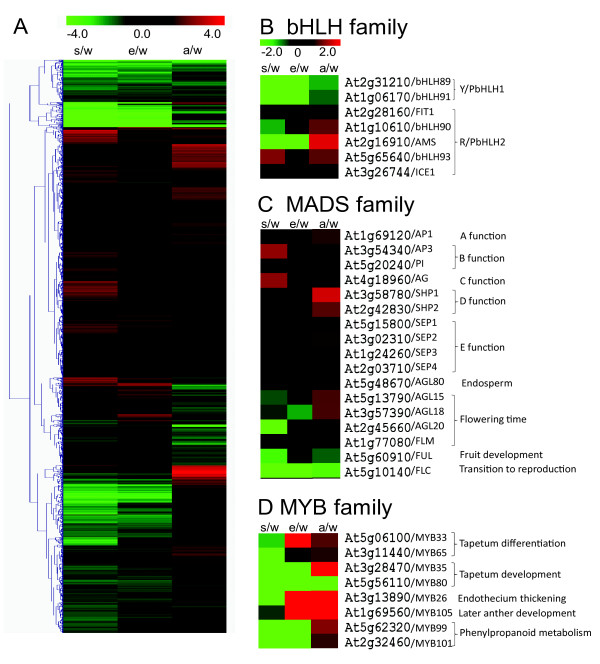
Figure 5.
Expression distribution of all genes differentially expressed and specific gene families. (A) Hierarchical clustering of genes differentially expressed in at least one mutant. (B-D) Heat-map of bHLH, MADS, MYB genes with putative or known function in male-reproductive development. The number indicate logarithm ratio of the fold change in mutant compared with wild-type anther. "w" represents wild-type anther and "s", "e" and "a" represents spl, ems1 and ams. Red color represents genes which have higher expression level in mutants and green indicates reduced expression.

