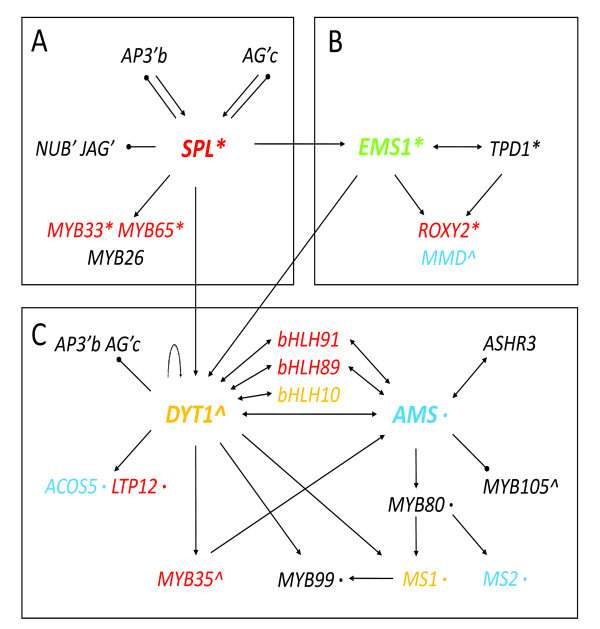
Figure 8.
Gene regulatory network of anther development during early stages. Gene regulation is represented by T-bars (negatively) and arrows (positively). The direct regulation confirmed by experiment is represented in bold line. Genes encoding proteins with interaction is represented by double arrows. Gene expression patterns in different tissues are shown by colors (blue for anther specific; red for anther-preferential; green for reproductive-preferential and yellow for genes not included in ATH1 chip). Gene function in tapetum formation is marked by an apostrophe; in pollen wall formation by an asterisk; in callose dissolution by double asterisks; in stamen and petal formation by the letter b; in stamen and carpel formation by the letter c.

