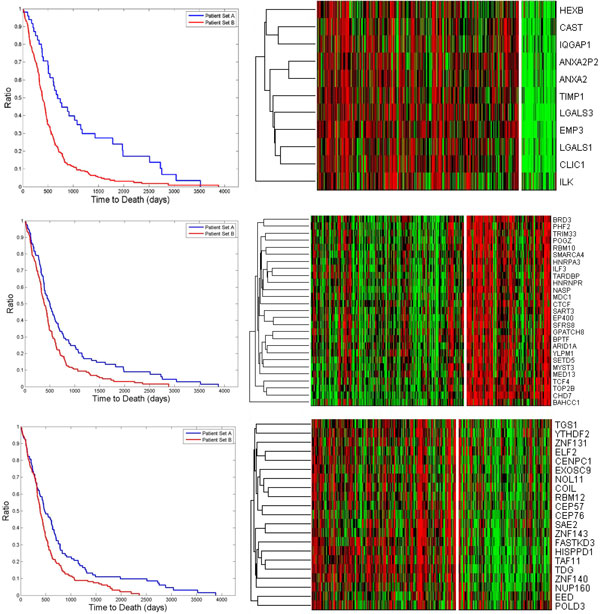
Figure 1.
Kaplan-Meier curves and heatmaps for two groups of patients with significantly different survival times identified using three networks. Top: Left - The Kaplan-Meier curve for the patients separated using the immune response network #1. Right - The heatmap of the gene expression values for the genes in the representative network #1. The vertical white line indicates the separation between short survival (left to the white line) and long survival (right to the white line) groups. The density of the representative network is 0.6928 and the p-value is 5.7 × 10⁻⁵. Middle: The Kaplan-Meier curve and heatmap for the chromatin modification network #6. The density of the representative network is 0.6951 and the p-value is 0.0016. Bottom: The Kaplan-Meier curve and heatmap for the mitotic cycle network #13. The density of the representative network is 0.6764 and the p-value is 0.006774.

