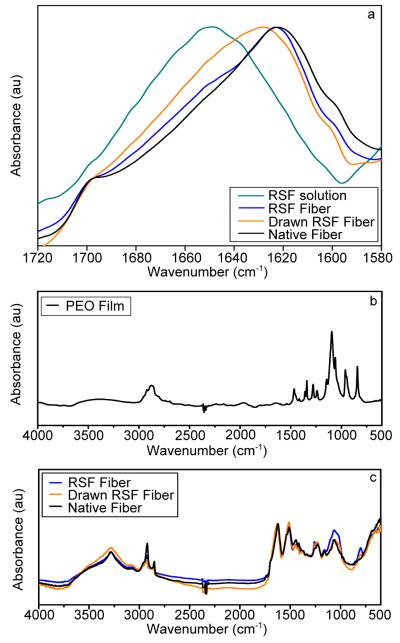
Figure 4. Structural Characterization of Silk Fibers via Fourier Transform Infrared Spectroscopy (FTIR).
FTIR spectra for 8% RSF solution, undrawn RSF fibers, drawn RSF fibers and native B. mori fibers illustrate the secondary structures present. (a) The shift of the peak of the amide I band (1580 to 1720 cm−1) to lower wavenumbers indicates higher β-sheet content in both native and RSF fibers compared to 8% RSF solution. The characteristic shape of the drawn RSF fibers indicates silk I content that is absent from undrawn fibers. (b) Full FTIR spectrum for PEO film. (c) Full FTIR spectra for undrawn and drawn RSF fibers and native silk illustrate that PEO is not present in any of the fibers.

