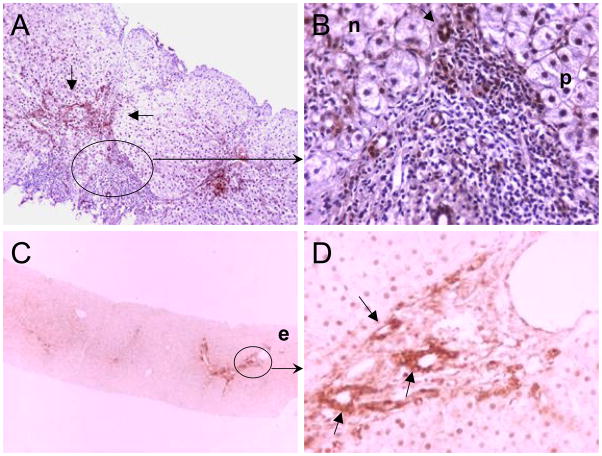
Fig. 1. Representative examples of DcR3 localization in CHC with fibrosis.
In upper case (panels A & B), DcR3 immunoreactivity (dark brown indicated by arrows) was detected in certain bile duct epithelial cells, and infiltrating lymphocytes were largely negative for DcR3. In lower case stained with DAB without counterstain, DcR3 immunostaining (red-brown area marked by arrows) was also seen in biliary ducts and some endothelial cells were DcR3 positive (marked by e in panel C). Both DcR3 positive (dark brown indicated by p) and negative (light blue indicated by n) hepatocytes’ nuclei were detected in panel B (DAB, haematoxylin counterstain). Also, DcR3 positive hepatocytes’ nuclei were readily observed in panel D without counterstain. Original magnification: A, x100; B & D, x400; C, x40.

