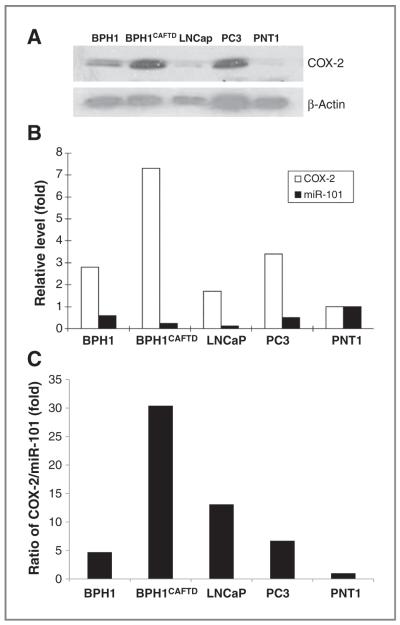
Figure 1.
The expression levels of COX-2 and miR-101 in prostate cell lines. A, comparison of COX-2 expression in various prostate cell lines. COX-2 protein levels in BPH1, androgen receptor–positive prostate tumorigenic cell lines (BPH1CAFTD and LNCap), androgen receptor–negative prostate tumorigenic cell line (PC3), and in nontumorigenic human prostatic cell line (PNT1). B, the expression levels of COX-2 and miR-101 in prostate cell lines. COX-2 levels were analyzed by Western blotting and semiquantified on the basis of COX-2/β-actin relative intensity. Bio-Rad Quantity One software was used for densitometric analysis of the Western blots. MiR-101 levels were analyzed by quantitative RT-PCR. The fold changes of each cell line were calculated by comparing with PNT1. C, the ratio of COX-2 to miR-101 in prostate cells.

