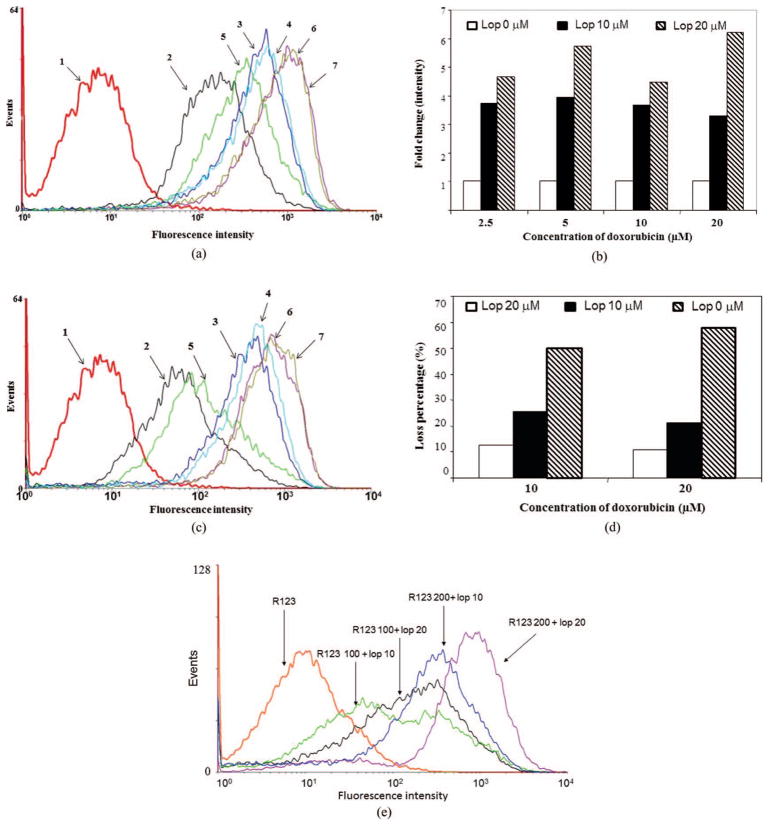
Figure 3.
Flow cytometric analysis of the net uptake of doxorubicin and rhodamine 123 and eflux of doxorubicin. (a) and (b) Fluorescent intensity after treatment with doxorubicin (10 and 20 μM) alone or in combination with loperamide (10 and 20 μM) for 3 hr, showing loperamide-mediated increase of doxorubicin accumulation. (a) Representative of the flow cytometric analysis. (b) Fold change in the intracellular fluorescent signal intensity in the presence loperamide relative to doxorubicin alone. (c) and (d) Fluorescent intensity following removal of doxorubicin (10 and 20 μM), but not loperamide (10 and 20 μM) for 2 hr, showing decreased eflux of doxorubicin by loperamide. (c) Representative of the flow cytometric analysis. (d) Loss percentage of the intracellular fluorescent signal in the presence or absence of loperamide. Samples in (a) and (c): (1) untreated; (2) doxorubicin 10 μM; (3) doxorubicin 10 μM + loperamide 10 μM; (4) doxorubicin 10 μM + loperamide 20 μM; (5) doxorubicin 20 μM; (6) doxorubicin 20 μM + loperomide 10 μM; (7) doxorubicin 20 μM + loperomide 20 μM. (e) Fluorescent intensities in MCF-7/MDR1 cells were analyzed by flow cytometry after treatment with rhodamine 123 (100 μM) alone or in the combination with rhodamine 123 (100 or 200 μM) and loperamide (10 and 20 μM) for 3 hr.

