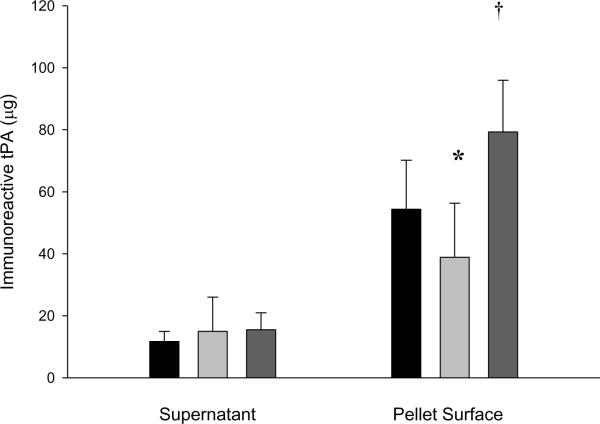
Figure 6.
Effect of ultrasound on tPA release from TELIP. Immunoreactive tPA levels of TELIP fractions after treatment with color Doppler ultrasound in vitro. Values are mean ± S.D. (n = 3−8). Black bars are no ultrasound; light gray bars are 0.2 MI ultrasound; dark gray bars are 0.4 MI ultrasound. The star denotes a significantly decreased mean level (p < 0.05) and the dagger denotes an increased mean level (p < 0.005) of immunoreactive tPA exposed, but tightly bound to the liposomal surface, relative to the non-sonified control value.

