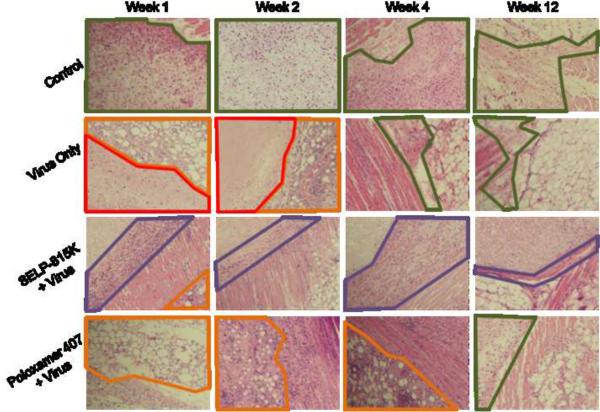
Figure 6.
Effect of matrix mediated controlled release of adenovirus on injection site structure visualized via H&E stained injection sites from weeks 1,2,4, and 12 (left to right) and groups Control, Virus Only, SELP 815K + Virus, and Poloxamer 407 + Virus (top to bottom). Normal fibrosis (green outline) due to injection is seen in control animals while necrotic tracts (red outline) and adipocytic necrosis (orange outline) can be seen in Virus Only weeks 1 and 2. Adipocytic necrosis is also seen in weeks 1, 2, and 4 in Poloxamer 407 + Virus. Progressive encapsulation (purple outline) is seen in SELP 815K + Virus panels.

