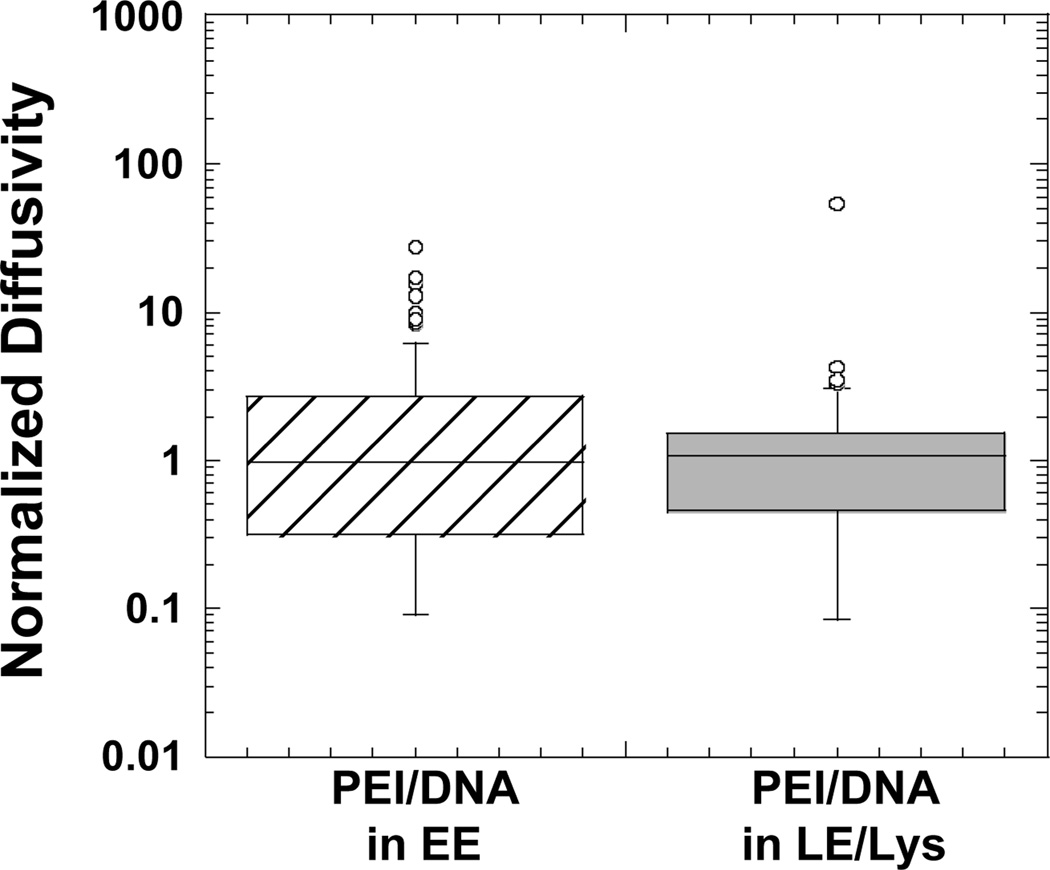
Figure 6.
Boxplots of normalized diffusivities of PEI/DNA complexes transporting within EE or LE/Lys at a time scale of 10 s. Values were normalized to the geometric mean diffusivity value. The number of PEI/DNA tracked are n = 81 (PEI/DNA in EE) and n = 61 (PEI/DNA in LE/Lys). There is no statistically significant difference between the groups as determined by student t-test.

