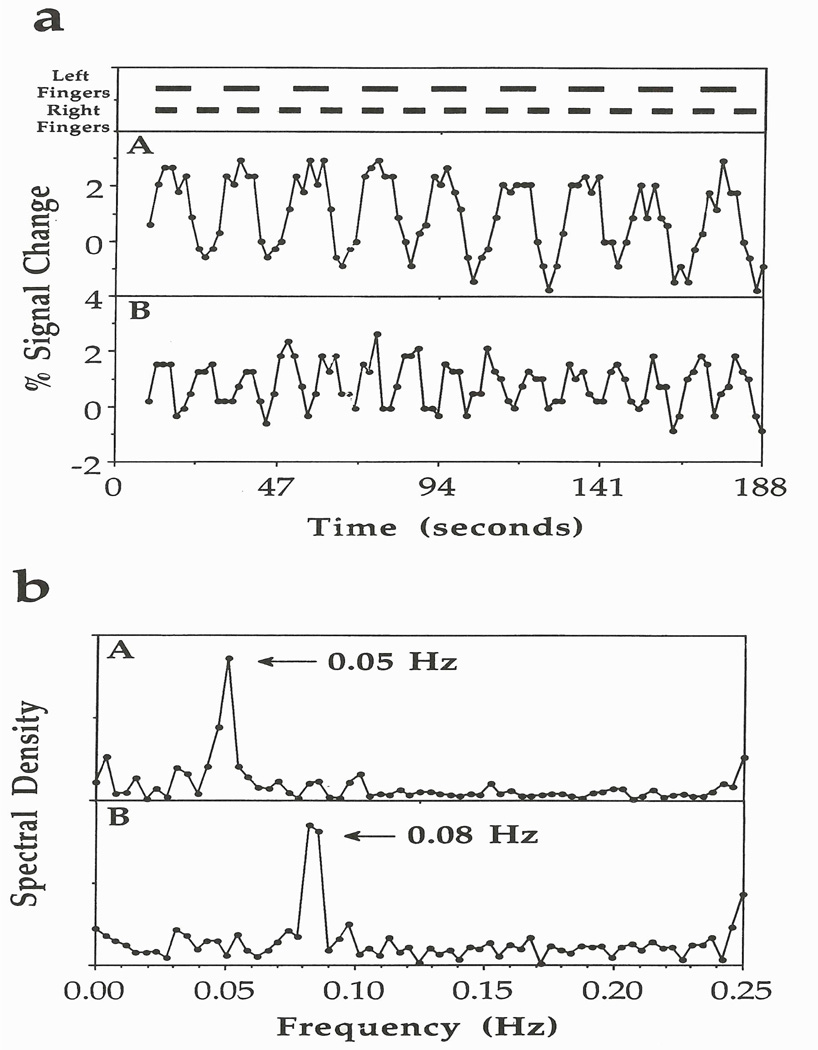
Figure 1.
Plots from the left and right pixels of the motor cortex in the asynchronous bilateral finger-tapping experiment. At the top is the activation paradigm that involves on/off frequencies of 0.05 Hz for finger movement of the left hand and of 0.08 Hz for finger movement of the right hand. (a) Plots in boxes A and B correspond closely with left and right finger movements, respectively. (b) Plots of the spectral density versus frequency from the pixels in boxes A and B, which reveal peaks at the activation frequencies that correspond also to the left-and right-hand activation frequencies, respectively. Figure 1 reprinted from Bandettini et al. 1993. Magn. Reson. Med. 30:161–173, where it originally appeared as Figure 13.

