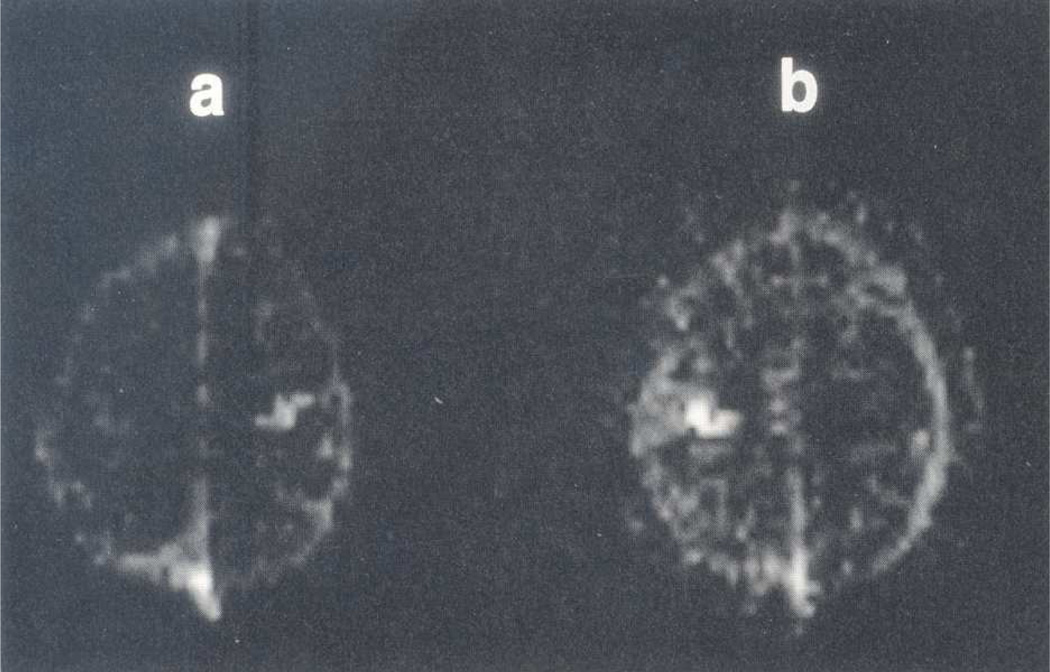
Figure 2.
Functional images obtained from the Fourier transform data set of Fig. 1 in which finger movement of the left and right hands was at on/off frequencies of 0.05 and 0.08 Hz, respectively. (a) Spectral density image at 0.08 Hz reveals high signal intensity in the left motor cortex. (b) Spectral density image at 0.05 Hz reveals high signal intensity in the right motor cortex. Figure 2 reprinted from Bandettini et al. 1993. Magn. Reson. Med. 30:161–173, where it originally appeared as Figure 14.

