
Figure 14.
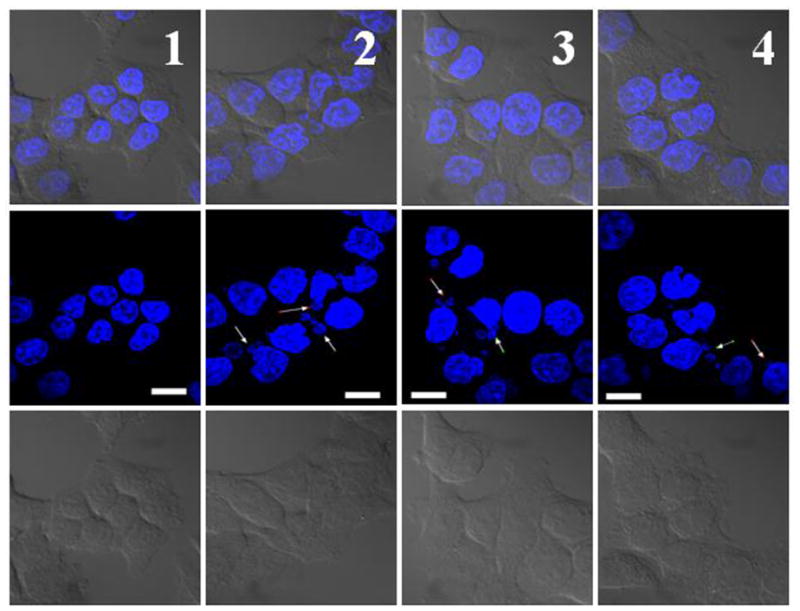
Nuclear fragmentation in HCT-116 cells treated with drug/conjugates. Untreated cells (column 1); 5 nM SN38 (column 2); 40 nM G3.5-gly-SN38 (column 3); 120 nM G3.5-βala-SN38 (column 4). Scale bar is 10 μm. Arrows indicate nuclear fragments. From bottom: 1st row, differential interference contrast image; 2nd row, fluorescence image; 3rd row, overlay of differential interference contrast and fluorescence images. With permission from Ref [53].