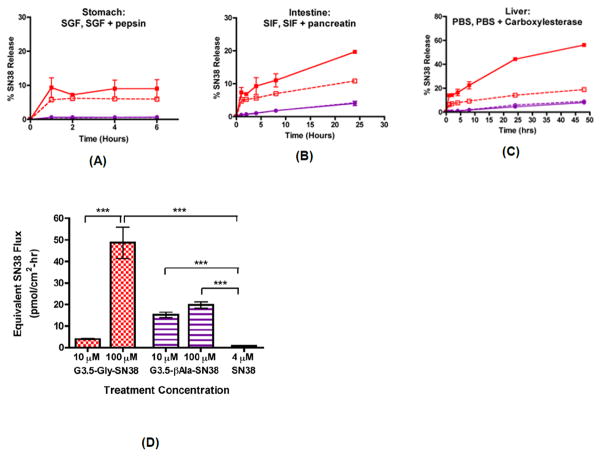
Figure 15.
Stability and transepithelial transport of G3.5-Gly-SN38 and G3.5-βAla-SN38 conjugates. Release of SN38 was monitored in simulated conditions of the stomach for 2 hours (A), intestine for 24 hours (B) and liver for 48 hours (C). Mean ± standard deviation (n=2). G3.5-Gly-SN38 is represented by red squares and G3.5-βAla-SN38 is represented by purple circles. Buffers without enzymes are depicted as dashed lines with open symbols and buffers with enzymes are depicted as solid lines with filled symbols. (D) Equivalent SN38 flux across differentiated Caco-2 monolayers treated with G3.5-SN38 conjugates and SN38. Equivalent SN38 flux was calculated by multiplying the measured molar flux of the conjugates with the number of SN38 molecules per dendrimer. Mean ± standard deviation (n=4). (***) indicates a significant difference with p<0.001. With permission from Ref [28].

