
Figure 3.
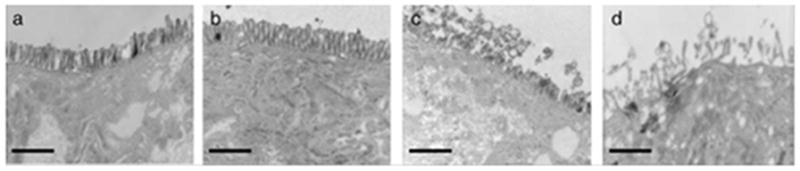
TEM images of Caco-2 cell monolayers after treatment with G4.0-NH2 dendrimers for 2 h: A. control cells; B. 0.01 mM G4.0-NH2; C. 0.1 mM G4.0-NH2; D. 1.0 mM G4NH2 (magnification=12,500x). Scale bars = 1 mm. With permission from Ref [18].
Official websites use .gov
A
.gov website belongs to an official
government organization in the United States.
Secure .gov websites use HTTPS
A lock (
) or https:// means you've safely
connected to the .gov website. Share sensitive
information only on official, secure websites.
TEM images of Caco-2 cell monolayers after treatment with G4.0-NH2 dendrimers for 2 h: A. control cells; B. 0.01 mM G4.0-NH2; C. 0.1 mM G4.0-NH2; D. 1.0 mM G4NH2 (magnification=12,500x). Scale bars = 1 mm. With permission from Ref [18].