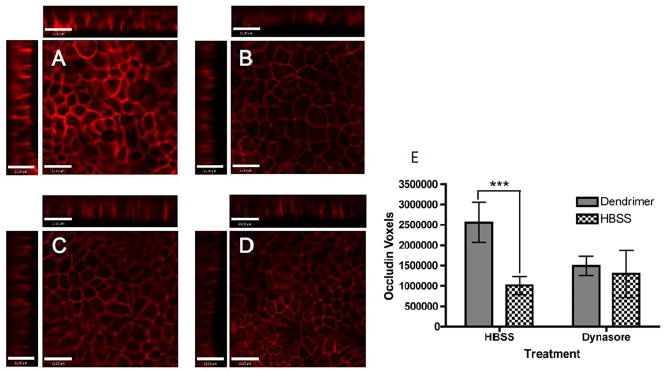
Figure 7.
Transpeithelial transport and cellular uptake mechanism of PAMAM G3.5-COOH; A–D. Occludin staining in the presence and absence of Oregon green labeled G3.5-COOH dendrimers in Caco-2 cells treated with HBSS or Dynasore. A. G3.5-COOH/HBSS, B. HBSS only C. G3.5-COOH/Dynasore and D. Dynasore only. Main panels illustrate the xy plane; horizontal bars illustrate the xz plane; vertical bars illustrate the yz plane. Scale bars equal 21 μm. E. Quantification of Occludin staining. Results are reported as mean +/− standard deviation with n=4. (***) indicates p<0.001. With permission from Ref [27].

