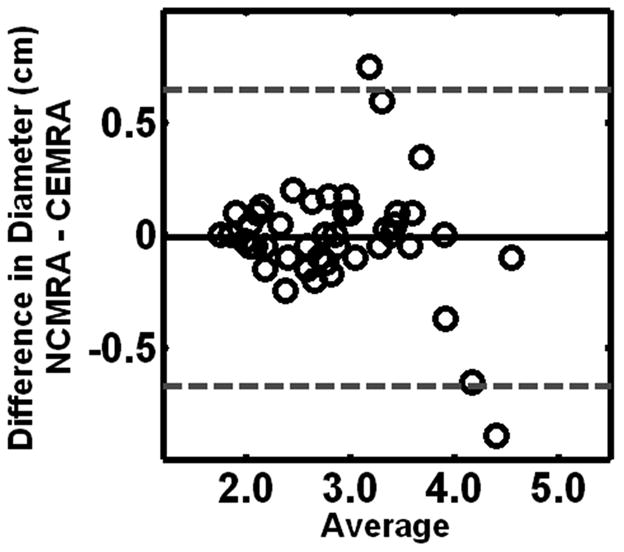
Figure 5.

Bland-Altman plot shows that overall measurements made with 3D NC-MRA and CE-MRA data sets were in good agreement with no significant difrerence in measured values. Bland-Altman analysis revealed a mean measured difference (NC-MRA minus CE-MRA) in aortic diameter between the two techniques of −0.073+/−0.144 cm upper and lower 95% limits of agreement = 0.210 and −0.357, respectively.
