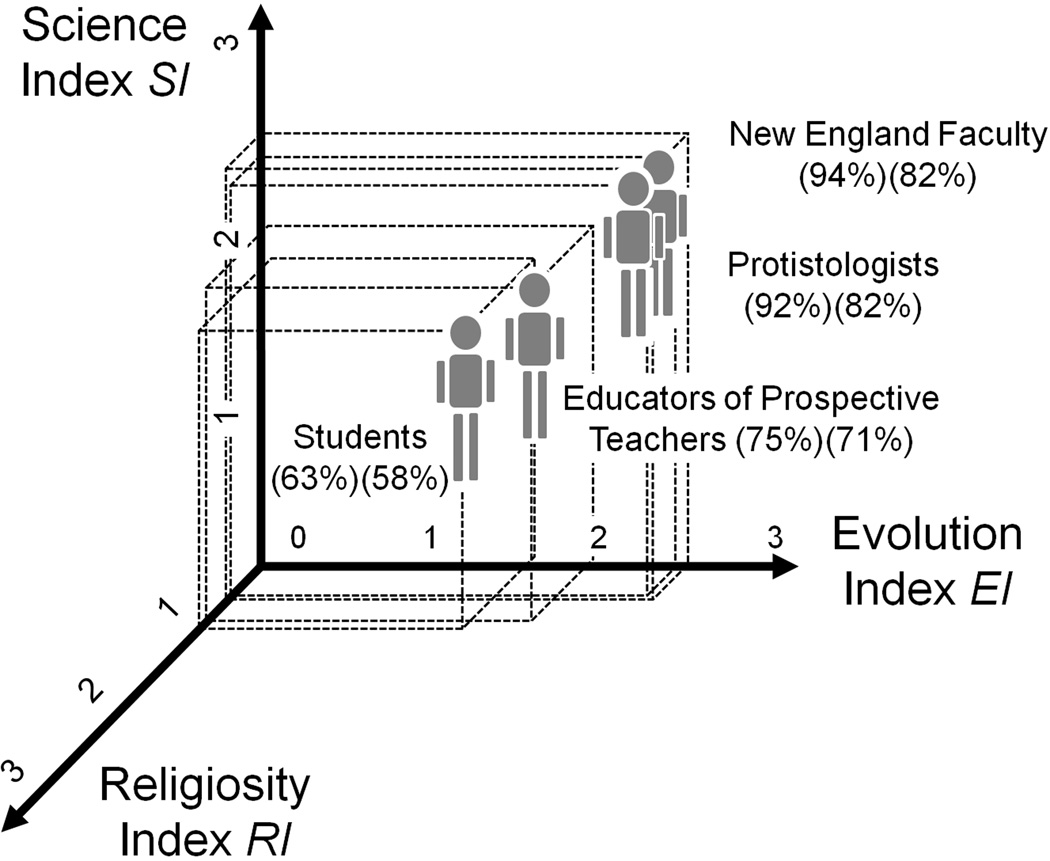
Fig. 2.
Acceptance of evolution plotted as function of religiosity (RI), science (SI), and evolution (EI) indexes. Each index ranges from 0 to 3 (least to most religious or knowledgeable about science or evolution; see text for details). The three-dimensional landscape is consistent with the theoretical parameters depicted in Fig. 1. The New England faculty held the highest acceptance of evolution position (N = 244; RI = 0.49; SI = 2.49; EI = 2.49), followed by protistologists (N = 50; RI = 0.46; SI = 2.30; EI = 2.48), educators of prospective teachers (N = 62; RI = 0.83; SI = 1.96; EI = 1.96), and students (N = 827; RI = 0.89; SI = 1.80; EI = 1.60). Percentage values written within brackets correspond to responders admitting to accept evolution openly regardless of others opinions (first value), or thinking that evolution is definitely true (second value).

