
Fig. 1.
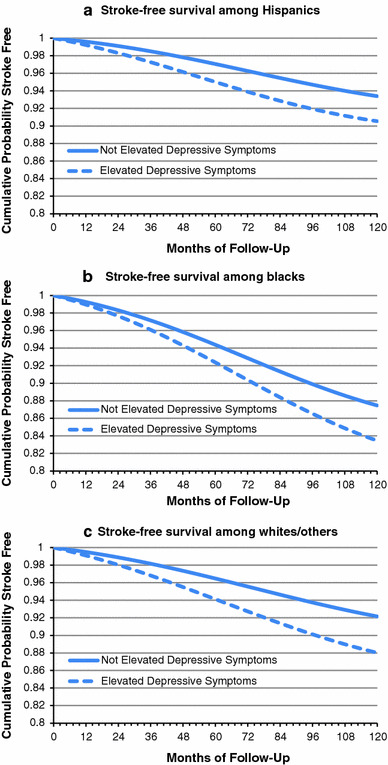
Smoothed survival curves by baseline elevated depressive symptoms, adjusted for demographic covariates (age at baseline, southern birth, mother’s and father’s education) with time-varying relationship between month of follow-up and baseline depressive symptoms. a Stroke-free survival among Hispanics. b Stroke-free survival among blacks. c Stroke-free survival among whites/others. Solid line: not elevated depressive symptoms at baseline, dashed line: elevated depressive symptoms at baseline