
Figure 1.
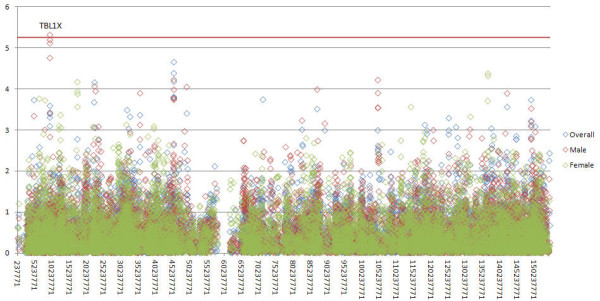
Plot for -log10 (P values) for the overall, male-specific and female-specific tests based on the meta-analyses. The red line indicates the threshold for chromosome-wide multiple testing correction.
Official websites use .gov
A
.gov website belongs to an official
government organization in the United States.
Secure .gov websites use HTTPS
A lock (
) or https:// means you've safely
connected to the .gov website. Share sensitive
information only on official, secure websites.
Plot for -log10 (P values) for the overall, male-specific and female-specific tests based on the meta-analyses. The red line indicates the threshold for chromosome-wide multiple testing correction.