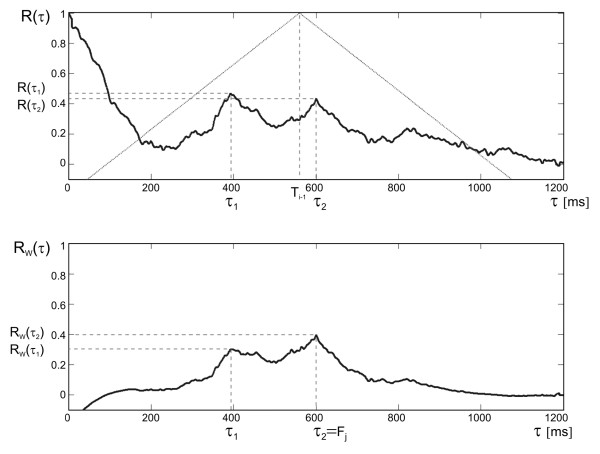
Figure 5.
Improved peak detection algorithm. General idea of correction of the autocorrelation function using a triangular window. The upper plot presents the autocorrelation R(τ) and the triangular window (W = 1.5) centered according to the last correctly measured interval. The plot below presents the RW(τ) function obtained after correction of R(τ). The correction enables the selection of an appropriate interval value τ2 even when a false maximum R(τ1) was caused by interferences.

