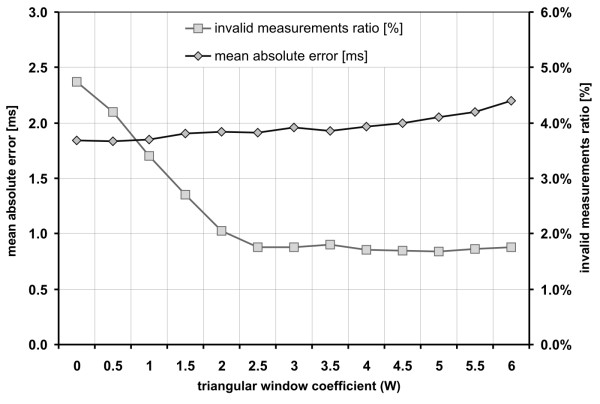
Figure 8.
Triangular window width. The chart presents the influence of triangular window parameter W on the mean absolute interval error and on the number of invalid measurements rejected during the validation stage. The TUS signal was calculated for W values varying from 0 (no windowing) to 6 (the most narrow window), while the AF window length L = 2.5 and shift increment S = 1/5.

