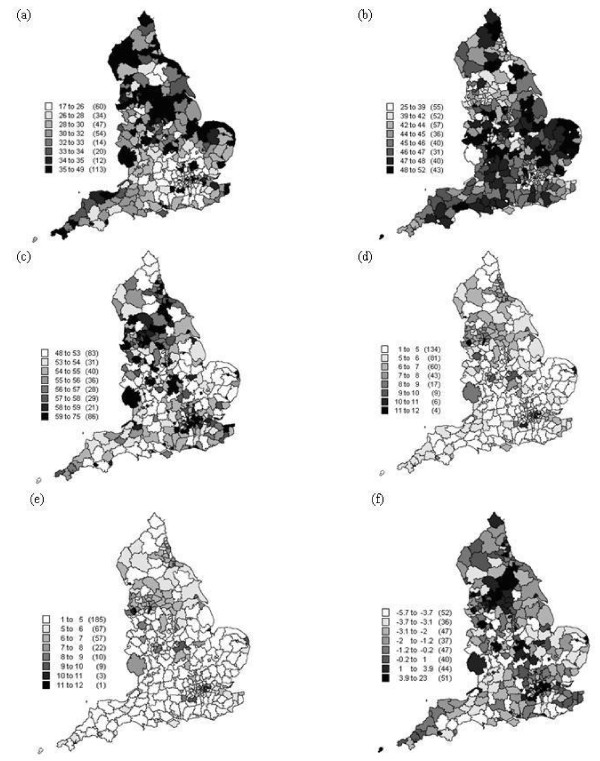
Figure 2.
The spatial distribution of the covariates used in the analysis (a) percentage of socio-grade IV and V, (b) percentage of married female population, (c) percentage of single female population, (d) percentage of lone parent households, (e) percentage of female lone parent households and (f) the Townsend index.

