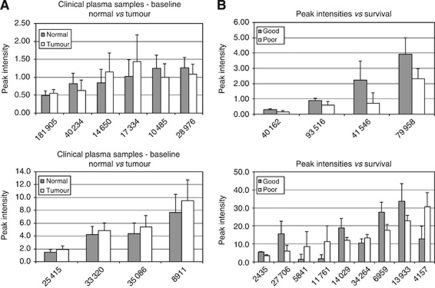
Figure 2.
Peak intensity data at baseline for (A) oesophageal cancer patients vs case controls and (B) according to survival. Sample group statistics (mean and s.d.) obtained for (A) plasma peaks (m/z) differing significantly (P<0.05, appropriate parametric or non-parametric test) between case controls (normal, n=36) and oesophageal cancer (tumour, n=21) patients at baseline or (B) according to survival from date of diagnosis, between the greater than 11 months group (good, n=5) and the <7 months group (poor, n=5).

