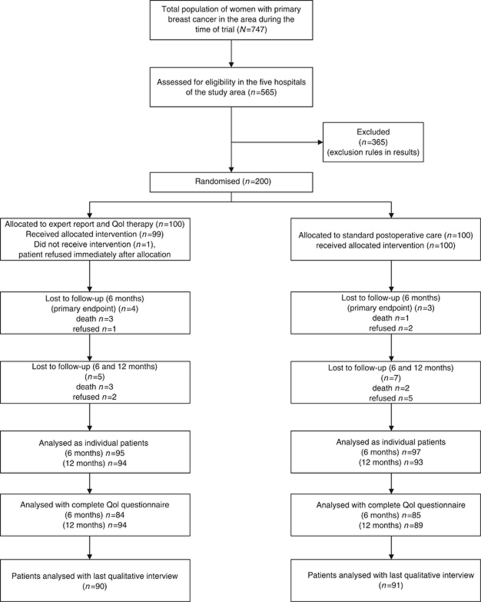
Figure 4.
Trial profile: flow of patients through each stage of the study. Complete=questionnaire answering the primary end point of the study. In Figure 6, only 83 instead of 85 patients could be analysed in the control group because no data were given for 1/10 QoL dimensions. Since, however, the two patients showed breakdowns in more than one dimension, the primary end point could be analysed and counted in them. Flowchart was constructed according to Altman (1996).

